I Built Airflow, Spark, and Iceberg by Hand in MySQL
I built my market data platform twice and turned a 12 hour process into a 2 minute process.
Version 2 is the one that has a modern data stack. PySpark on a two-node Kubernetes cluster hand built, an Apache Iceberg lakehouse on MinIO behind a Polaris catalog, Airflow kicking off the runs. It computes 11 technical indicators across 13,000+ symbols every hour.
Version 1 is the fun one. It taught me what these tools are for. It was a MySQL monolith of 35+ tables, 41 stored procedures, 8 scheduled events, and about 329 million rows in each of the six primary tables, just under 2 billion rows in total. Every transform, every indicator, all the scheduling and coordination ran inside the database, all by hand. At the time I didn’t know about the modern tools. I just had problems and MySQL.
All the SQL in this post is pulled from the schema dump in the repo’s legacy/ directory. Trimmed for readability, not cleaned up.
The data model
Three tiers. Raw* staging tables took API responses as is. FinancialData held processed OHLCV bars. Six indicator tables (boilerband, macd, sar, directionalmovement, chaikinoscillator, and the indicator columns on FinancialData itself) held transformed data alongside a key from where it came from.
Here’s the core table:
CREATE TABLE `FinancialData` (
  `FinancialDataID` int NOT NULL AUTO_INCREMENT,
  `StockID` int NOT NULL,
  `StockDate` datetime DEFAULT NULL,
  `Open`  decimal(20,5), `Low`   decimal(20,5),
  `High`  decimal(20,5), `Close` decimal(20,5),
  `Volume` decimal(20,5),
  `EMA` decimal(20,5), `VWAP` decimal(20,5),
  `RateOfChange` decimal(20,5), `OnBalanceVolume` decimal(20,5),
  PRIMARY KEY (`FinancialDataID`,`StockID`),
  UNIQUE KEY `StockID_Date_Idx` (`StockID`,`StockDate`),
  KEY `idx3` (`StockID`,`FinancialDataID`,`StockDate`,`Close`)
) ENGINE=InnoDB AUTO_INCREMENT=320075156
PARTITION BY HASH (`StockID`) PARTITIONS 100;
You’re reading it correct, AUTO_INCREMENT=320075156. While writing this post I counted the live tables:
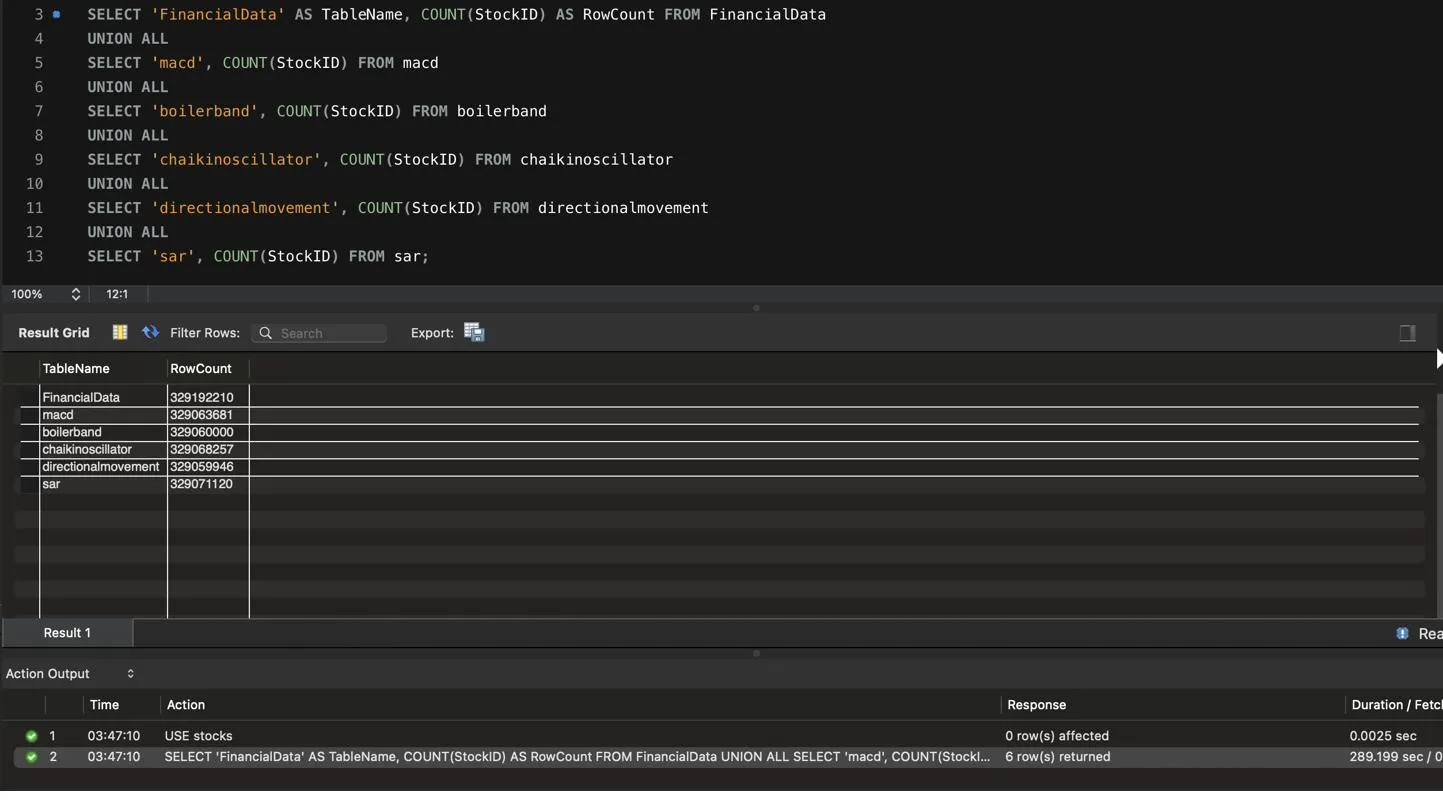
About 329 million rows in each of the six, just under 2 billion in total. The COUNT itself took 289 seconds to execute. The database sits in my homelab as a Kubernetes StatefulSet.
Hash partitioning on StockID. Every read and every write in this system is per-symbol. Hash partitioning 100 ways on StockID meant any query that included a symbol pruned to a single partition, and I had four concurrent workers processing four different symbols. Six indicator tables were partitioned the same way, which put about 700 physical partitions under the data across the seven tables.
I had to change from a single primary key setup to a composite key setup. MySQL requires every unique key on a partitioned table to include the partition key. So PRIMARY KEY (FinancialDataID, StockID) and UNIQUE KEY (StockID, StockDate) aren’t modeling decisions, they’re the price of partitioning. It also means StockID ended up in almost every unique constraint I added to this database. Iceberg’s hidden partitioning solves exactly the same problem, it keeps the partition layout from leaking into my logical schema.
Scheduling without a scheduler
v1 didn’t have an orchestrator. It had scheduled events firing every 2 seconds, each one gated by an advisory lock ensuring a single instance ran at a time:
CREATE EVENT ProcessRawDataThread0
ON SCHEDULE EVERY 2 SECOND
DO BEGIN
    IF (IS_FREE_LOCK('ProcessRawDataThread0') = 1) THEN
        SELECT GET_LOCK('ProcessRawDataThread0', 0);
        CALL stocks.processRawTableLoop(4, 0);
        SELECT RELEASE_LOCK('ProcessRawDataThread0');
    END IF;
END
GET_LOCK(name, 0) is a non-blocking try-acquire. If the last cycle is still running, this one sleeps for 2 seconds and then tries again. Four of these scheduled events, Thread0 - Thread3, built my worker pool. A scheduler with concurrency control, written in SQL, living inside the storage engine.
Spreading the work
Work distribution was a modulo over a queue. Each worker’s cursor only ever saw its slice:
DECLARE allSymbolsCurs CURSOR FOR
    SELECT Symbol
    FROM rawFinancialDataQueue
    WHERE RawFinancialDataQueueID % iTotalThreads = iRemainder
    ORDER BY InsertedTime ASC;
Advisory locks guaranteed a single instance would run for each scheduled event, the next piece to tackle was table-level exclusivity. Two workers must never write to the same table at the same time. I created the ProcessThreadManager table to keep track of what each thread was currently doing. Having this table meant I had a single query to check what every thread was doing:
-- try to claim the table
UPDATE ProcessThreadManager
SET `Table` = 'rawFinancialDataQueue', StartDateTime = NOW()
WHERE ProcessThreadManagerID = ieventID;

DO SLEEP(.25);

-- did exactly one thread claim the table?
IF ((SELECT COUNT(*) FROM ProcessThreadManager
     WHERE `Table` = 'rawFinancialDataQueue') = 1) THEN
    -- we own it, do the work
ELSE
    -- another thread claimed it in the same window, back off
    UPDATE ProcessThreadManager SET `Table` = NULL
    WHERE ProcessThreadManagerID = ieventID;
END IF;
Write your claim, wait 250ms, and then verify you’re the only thread. If two threads claimed the same table in the same window, both see a count of 2 and both back off. It’s a poor man’s compare-and-swap with built-in race detection, and I built it because I kept crashing my database from two threads racing each other inside the same critical section. While building StockAlgo v2 I’d learn this type of problem is why coordination services exist, and why Airflow puts task state behind real database transactions in its metadata DB.
Work-stealing, in a stored procedure
The indicator dispatcher was another speed optimization trick. Initially the indicators were processed in a fixed order and didn’t allow a thread to move to step B until step A was complete. Since it doesn’t matter which indicator processes first, I made every indicator step A. I used a temporary table with every indicator that needed to be processed, queried my ProcessThreadManager to check if the indicator was being executed by another thread, once a free indicator was found the thread would run the process for the indicator and remove the indicator from the temporary table. A symbol was finished once the temporary table was empty. Here’s the loop walking the set of active indicators and grabbing whichever one was free:
-- allIndicators temp table = the work remaining for this symbol
WHILE ((SELECT COUNT(*) FROM allIndicators) > 0) DO

    -- Indicator: MACD. Is it still pending, and is the table available?
    CASE WHEN ((SELECT FIND_IN_SET('macd', TableName) FROM allIndicators ...) > 0
        AND (SELECT COUNT(*) FROM ProcessThreadManager WHERE `Table` = 'macd') = 0) THEN

        -- claim it, verify the claim, then insert only missing rows
        INSERT INTO raw_to_macd(StockID, StockDate, FinancialDataID, MACD, MACD_Signal, MACD_hist, UpdateTime)
        SELECT ald.StockID, ald.StockDateTime, ald.FinancialDataID,
               ald.MACD, ald.MACD_Signal, ald.MACD_hist, NOW()
        FROM alldata ald
        LEFT OUTER JOIN macd md ON ald.FinancialDataID = md.FinancialDataID
        WHERE ald.StockID = iStockID AND md.FinancialDataID IS NULL;
    ...
If MACD’s table is claimed by another worker, the loop falls through and tries SAR. If SAR is held, Bollinger. Whatever’s free gets done. That’s a DAG scheduler executing whichever stage is ready, which is what Spark does, except Spark’s version doesn’t need a FIND_IN_SET.
The insert, LEFT OUTER JOIN ... WHERE md.FinancialDataID IS NULL means only rows that don’t already exist get inserted. That’s the “when not matched then insert” half of a MERGE statement, hand-written as an anti-join, and it’s what made every worker idempotent. Rerun a symbol and the join finds nothing new to do.
Getting writes right
The Raw* tables were constantly receiving new data from the API and I wanted to keep them as isolated as possible to avoid threading issues. The handy solution was to use temp tables to work with anything between the Raw* tables and the database. This was one of a handful of times when I created unique keys, StockID and StockDate, for a temp table and it paid off in spades. When data was ready to be processed it was inserted into a temp table, the temp table ran a duplication check via another anti-join against my partitioned keys:
CREATE TEMPORARY TABLE allDataForSymbol
    SELECT *, iStockID AS StockID
    FROM rawfinancialdata WHERE StockSymbol = vStockSymbol;

-- drop anything we already have (unique key: StockID, StockDate)
DELETE ads
FROM allDataForSymbol ads
INNER JOIN FinancialData fd
    ON fd.StockID = ads.StockID AND fd.StockDate = ads.StockDateTime;
And every transformation ran inside a ledger. Open a transaction row, do the work, then either stamp it with the row count and end time, or throw it away:
INSERT INTO raw_data_to_data_transaction(StockID, StartDateTime, CreatedDate)
VALUES (iStockID, NOW(), NOW());
SELECT LAST_INSERT_ID() INTO iTransactionID;

CALL rawFinancialDataToFinancialData(StockSym, ieventID, iRowsInserted);

IF (iRowsInserted > 0) THEN
    UPDATE raw_data_to_data_transaction
    SET RecordQuantity = iRowsInserted, EndDateTime = NOW()
    WHERE Raw_Data_To_DataID = iTransactionID;
ELSE
    DELETE FROM raw_data_to_data_transaction
    WHERE Raw_Data_To_DataID = iTransactionID;
END IF;
My favorite detail of the entire database is the initial insert to the raw_data_to_data_transaction table. Four threads run this loop at once, and every other concurrent write in the system goes through a lock or the claim protocol. This insert goes through nothing. It doesn’t need to, because of back pressure. Every surrounding write is serialized, so two threads reaching this statement at the exact same time is rare. The insert is tiny, so the collision window is small and the error handler is a CONTINUE handler, so a thread that loses the timing lottery times out and lands in the error log. The loop tries again until succeeding, nothing’s lost, it’s just late. I didn’t know the name for this initially, but I found out it’s optimistic concurrency. Skip the lock, accept the rare conflict, make retry free. It’s the same thing Polaris uses at the other end of this project’s history. When two writers race to swap the catalog pointer, one wins, and the loser re-reads and tries again. v1 protected everything except one write where losing cost nothing, and that exception was on purpose.
Staging, anti-join dedup, idempotent inserts, and a per-transformation ledger. That’s the guarantees Iceberg gives you when using it as a table format. ACID MERGE, snapshot isolation so readers never see a half-written state, and retries that are safe because a failed commit simply never becomes a snapshot.
Every stored procedure also carried the same error handling, so every failure landed in one table with the object name and the full error message, making it extremely easy to find what isn’t working:
DECLARE CONTINUE HANDLER FOR SQLEXCEPTION
BEGIN
    GET DIAGNOSTICS CONDITION 1 @errno = MYSQL_ERRNO, @ErrorMsg = MESSAGE_TEXT;
    INSERT INTO errorlog(ObjectName, ErrorNumber, ErrorMessage, CreatedDate)
    VALUES ('processRawTableLoop', @errno, @ErrorMsg, NOW());
END;
The analytical SQL was the good part
SQL’s good at a lot of things, but iterators are notoriously slow, so my solution was to use window functions. They’re fast if you write a good query, and they’re everywhere in modern SQL. Here’s a trickier example finding Bollinger Band local extrema. Rank every band value, then walk forward in time keeping only the rows that set a new best rank. Those survivors are the local extrema:
-- rank every upper-band value, highest first
INSERT INTO bbLocalMaxes(bbMaxRank, BoilerBandID, FinancialDataID, StockDate, UpperBandMax)
SELECT DENSE_RANK() OVER (ORDER BY UpperBandMax DESC),
       BoilerBandID, FinancialDataID, StockDate, UpperBandMax
FROM bbTimeFrameMaxes
WHERE UpperBandMax IS NOT NULL;

-- walk forward in time; keep a row only if it beats every rank seen so far
SET @iLastBBMaxRank = 100000000;
UPDATE bbLocalMaxes SET bbLastMax =
    CASE WHEN bbMaxRank < @iLastBBMaxRank
         THEN bbMaxRank AND @iLastBBMaxRank := bbMaxRank
         ELSE NULL END
ORDER BY StockDate ASC;
A DENSE_RANK for the global ordering, a user-variable running minimum for the time walk, and then a LEAD() over the survivors to attach each extremum to the next one. New local max or min means a breakout or an accelerating trend, so this little dance is the core of the Bollinger signal. These two queries took me a couple days to figure out. Before I switched to this method, I used an iterator, and it was the bottleneck of my entire database. The MACD side did the same style of work with AVG() OVER (PARTITION BY startRange, endRange ORDER BY StockDate) to get slope per trend range, and LAG() built an explicit parent-child lineage table so every row knew the row directly before it.
In v2 this whole category collapses into Spark window specs and lag() over a DataFrame. Same math, but the user-variable tricks and temp table choreography disappear.
Where it hit the wall
A full cycle, fetch through computed indicators, took about 12 hours. That was WAY too slow for me.
The bottleneck was on the Python side not the database. The fetch layer was an asyncio and multiprocessing worker pool of 25 workers pulling from thirteen API endpoints and feeding rows into MySQL, and the database chewed through its compute faster than Python could feed it.
Speeding up Python wouldn’t have saved the architecture, because the ceiling was still real. All the compute ran on one box, four workers sharing one InnoDB buffer pool, one redo log, one write path, cursors walking one row at a time. MySQL kept up with everything I could throw at it. It was never going to keep up with what Spark does to the same workload, because partitioning spread the data, but it couldn’t spread the box.
I didn’t know how to speed up my Python, so I researched it. That research led straight into the distributed computing world.
The other realization I had was v1 paid Alpha Vantage for thirteen endpoints, and several of them were pre-computed indicators, MACD and friends arriving as finished numbers. But the analytical work I kept building on top of those numbers, the extrema walks and slope calculations, had taught me what the underlying indicator math actually was, and it was windows and recursions I could write myself. I realized the premium I was paying was for simple mathematics. v2 buys nothing but raw bars and computes all eleven indicators from scratch, including the recursive ones vendors charge the most for.
v2, and the part nobody tells you
The same workload in v2 runs in about two minutes. Spark spreads the compute across executors, Iceberg makes the writes transactional, Airflow chains ingest into indicators. 12 hours to 2 minutes.
The distributed versions of these problems still bite, just differently. Scaling from one symbol to the full universe, I hit a 155,000 task partition explosion because I was unioning ~13,000 symbols’ histories together one symbol at a time instead of batching them. Which led to the driver OOM, because Spark’s metrics listener was tracking all 155k tasks in driver heap. Then Spark 4.0’s ANSI mode threw a divide-by-zero that exactly one symbol out of 9,691 was guaranteed to produce. Swapping hand-rolled primitives for professional tools changes where the failures happen, it doesn’t delete them.
The mapping
This is the realization the rebuild kept hammering home. Almost every tool in v2 replaced something I had written a poor man’s version of in v1:
| v2 component | What v1 hand-built | The v1 artifact |
|---|---|---|
| Airflow scheduler + DAG dependencies | Scheduled events gated by GET_LOCK / IS_FREE_LOCK | ProcessRawDataThread0..3 |
| Airflow metadata DB (transactional task state) | Write-then-verify claim protocol on a mutex table | ProcessThreadManager |
| Spark partitioning and shuffle | Modulo dispatcher over 100 hash partitions | processRawTableLoop(threadCount, threadIndex) |
| Spark DAG scheduler | Work-stealing WHILE loop over the indicator set | rawFinancialDataToFinancialData |
| Iceberg ACID MERGE (when not matched, insert) | Anti-join inserts + temp-table dedup + staging | LEFT OUTER JOIN ... IS NULL |
| Iceberg hidden partitioning | Partition key forced into every unique key | PRIMARY KEY (FinancialDataID, StockID) |
| Polaris optimistic commit (pointer swap, retry on conflict) | An unguarded concurrent insert protected by back pressure and a CONTINUE handler | raw_data_to_data_transaction |
Spark window specs / lag() | User-variable running mins over DENSE_RANK, explicit lineage table | bbGetLocalMinsAndMaxes, FinancialDataParentChild |
There’s quite a few similar features between the two versions. The centralized error log became fail_log, where a failed fetch lands as rows instead of killing the run. The transaction ledger became run_log, keyed so an Airflow retry is idempotent. Empty transactions are handled differently in both versions. In v1 empty transactions were deleted, while v2 keeps zero-success runs.
Why build the primitive at all
I wouldn’t ship v1’s architecture today. But when I picked Airflow, I knew exactly what its scheduler was doing, because I had written the event loop it replaced. When Spark shuffles data between executors, I know what the modulo and cursor version of that looks like and where it falls over. When Iceberg commits a snapshot, I know how many staging tables, anti-joins, and ledger rows that one commit replaces.
The difference between my versions and the professional versions is night and day. But I built mine first, and that’s why I understand theirs.
The full schema, all 41 stored procedures, and the ERD are in the legacy/ directory of the repo if you want to dig through the whole thing.